
Thermal loss layer
Heat-loss intensity appears over assets, routes, and systems without forcing teams into raw sensor tables.
HeatOptx Map
HeatOptx Map turns boilers, pipes, heat exchangers, process lines, and network zones into one readable thermal picture. Operators see where heat is leaving the system before it becomes another month of wasted fuel.
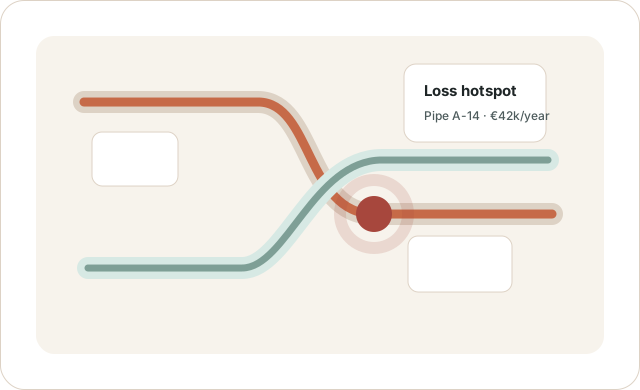
Heat-loss intensity appears over assets, routes, and systems without forcing teams into raw sensor tables.
Follow heat across boilers, buried pipes, loops, exchangers, tanks, and process lines from one map.
Energy, maintenance, and sustainability teams can work from the same visible source of truth.
Workflow
Import plant, thermal, meter, and inspection data.
Align assets, routes, and thermal readings into a single map.
Highlight high-loss zones and hand findings to Detect or ROI.
Common use cases
Next step

